Posts

Showing posts from February, 2013

Visualising AI Embeddings in APEX

Image
" To deal with hyper-planes in a 14-dimensional space, visualize a 3-D space and say 'fourteen' to yourself very loudly. Everyone does it."     - Geoffrey Hinton , 2018 Turing Award winner. Within the wonderful world of  Generative AI , one concept that is all the rage is RAG, or  Retrieval Augmented Generation , which is an  AI framework that combines the strengths of traditional information retrieval systems (such as databases) with the capabilities of generative large language models (LLM s) . RAG's goal is to improve the accuracy, relevance, and timeliness of information  generation  - such as  documents, text and images -  by optimizing LLM output.  When creating a RAG system, it’s essential to store information in a format that a LLM can retrieve. This is where  data is converted into embeddings through a pro...

Oracle Locator and Spatial

If you already use Oracle Spatial or Locator then you probably already know Simon Greeners SpatialDB Advisor blog, but if not then I can recommend it as an invaluable source of Spatial nuggets.  Whether you are just starting out with Spatial or have some level of experience with it you will find something there which will knock your socks off! When I was helping a client with creating a geo-spatial database I found it confusing with regard to what is included as part of the Locator licence ('free' with Enterprise Edition) instead of the additional fee option of Spatial.  One of Simons posts  really makes it clear what is and isn't included with Locator, and thus I was able to ascertain that the client only really needed the functionality available within Locator, resulting in a considerable saving on licence fees for the Spatial extension.

APEX and Graph Visualisation Libraries

Image
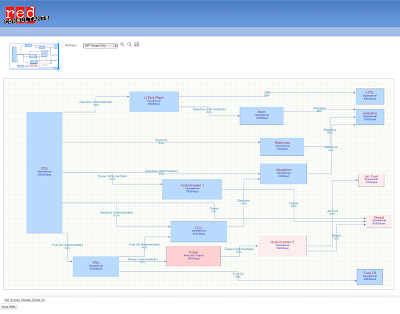
I was recently asked by a client to create a quick POC in APEX to demonstrate how relationships between physical assets (in this case oil refineries) could be maintained using a graphical tool.  So I looked at a number of different Javascript graphing libraries  and chose MXGraph from JGraph  which seemed to have the most features and looked relatively easy to integrate.   It's worth mentioning that it is not Open Source and has a fairly hefty licence fee. The requirement was to be able to show the process flow between units in a particular oil refinery with relationships representing the refined output from one processing unit and the input into another.  The idea is to build out quite detailed maps of the process flows within refineries and then use this with other 3rd party outage data to predict the affect on production and thus ultimately the change in price of crude and refined oil products. The POC was quite simple, as you can see from the scree...

Work Yourself Fitter

Image
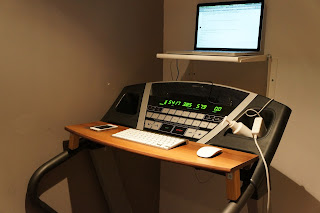
It's been a while since my last blog post but as I'm now looking for my next Oracle contract (hopefully APEX again purrrlease) I've a little time on my hands.  So I thought I would share with you my latest creation.  It's a variation on the Treadputer which is basically a treadmill adapted for use as a standup desk - you simply work and walk at the same time.  Yes I know it seems a little crazy but here's a picture of mine. Just working on this thing for around 3 hours a day at something like 1.5 miles per hour means I walk about 4.5 miles and burn around 600 extra calories. This is a home-brewed effort.  I already had the treadmill, so I added a shelf for the keyboard and mouse, plus a wall shelf to hold my laptop.  Of course I've tried to be as ergonomic as possible and placed the wall shelf so that my eye level is at the centre of the laptop screen, and the keyboard shelf is at the correct height so my forearms are horizontal. Now considering I've...