I'm on a train up to Liverpool for the UK Oracle User Group Tech 14 conference, and decided it's about time for a post showing something I've been working on. I don't post often these days, which I blame on work and family commitments, but is probably just down to pure laziness. Anyhow, I'm feeling in the mood so I'll just get on with it in case the desire to catch some zzz's becomes overwhelming. Also it takes my mind of the bad coffee served up on the train.
So, I've been getting into
D3 a little, which if you don't already know is a JavaScript library for manipulating data to create interactive graphs and charts. Some of the stuff people are creating using D3 is amazing, including
this dynamic bubble chart example. I thought I would use this example as the basis for creating a bubble chart in Apex, that dynamically updates with some cool transitions, using data from the database rather than the real time API in the example.
The demo can be found here (login using demo/demo):
https://apex.oracle.com/pls/apex/f?p=9208
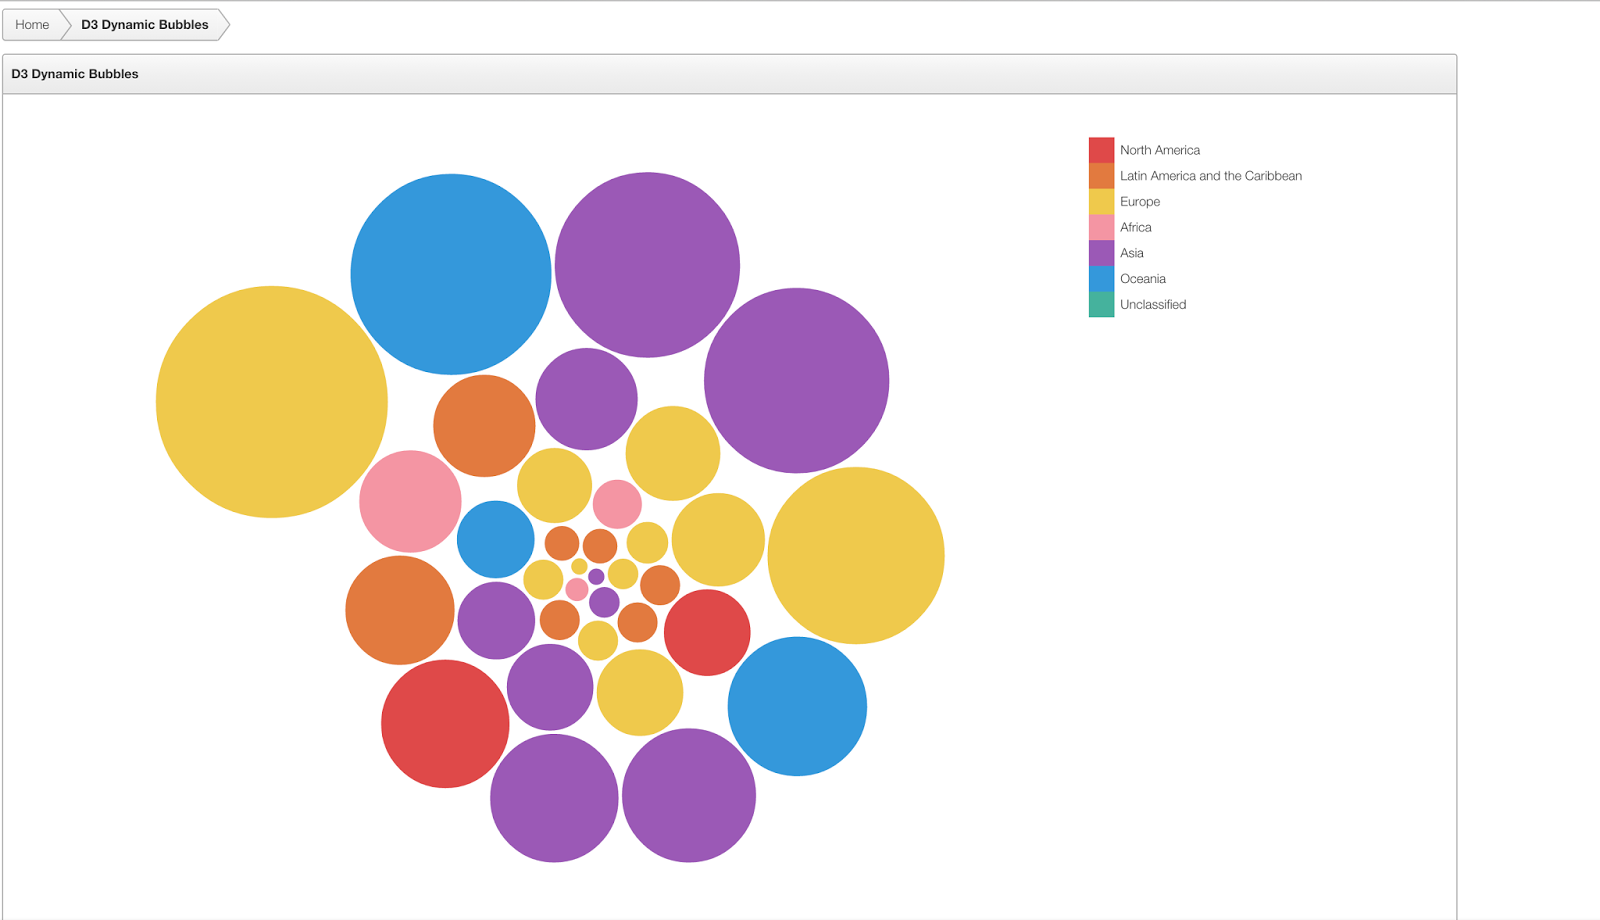
Here's a screenshot (not animated sorry, as no time to make one):
Each bubble in the demo is a country, and is coloured according to which region it belongs in. You can see the regions in the legend to the right. The size of each bubble is based on a simple value stored for each country, and is not representative of anything in particular (it's server hits on the original demo). I've stored a number of different values for each country and these are pulled from the DB using an Ajax call (apex.server.process) with a javascript interval which cycles through each set of data.
Interestingly, whilst I was working on this I noticed that Carsten Czarski was also working on some D3 demos (
here), and actually these helped me solve an issue I had (I ended up ditching a call to apex_util.json_from_sql as it wasn't correct for this).
The one thing I want add is text labels (country code and value), but I've not quite figured that out yet though will endeavour to do so as it will make it more intuitive.
I'll add another post later with all the code, which is really not that complex. Promise!


Comments