In my previous
post a couple of days back, I demonstrated a simple
APEX demo with
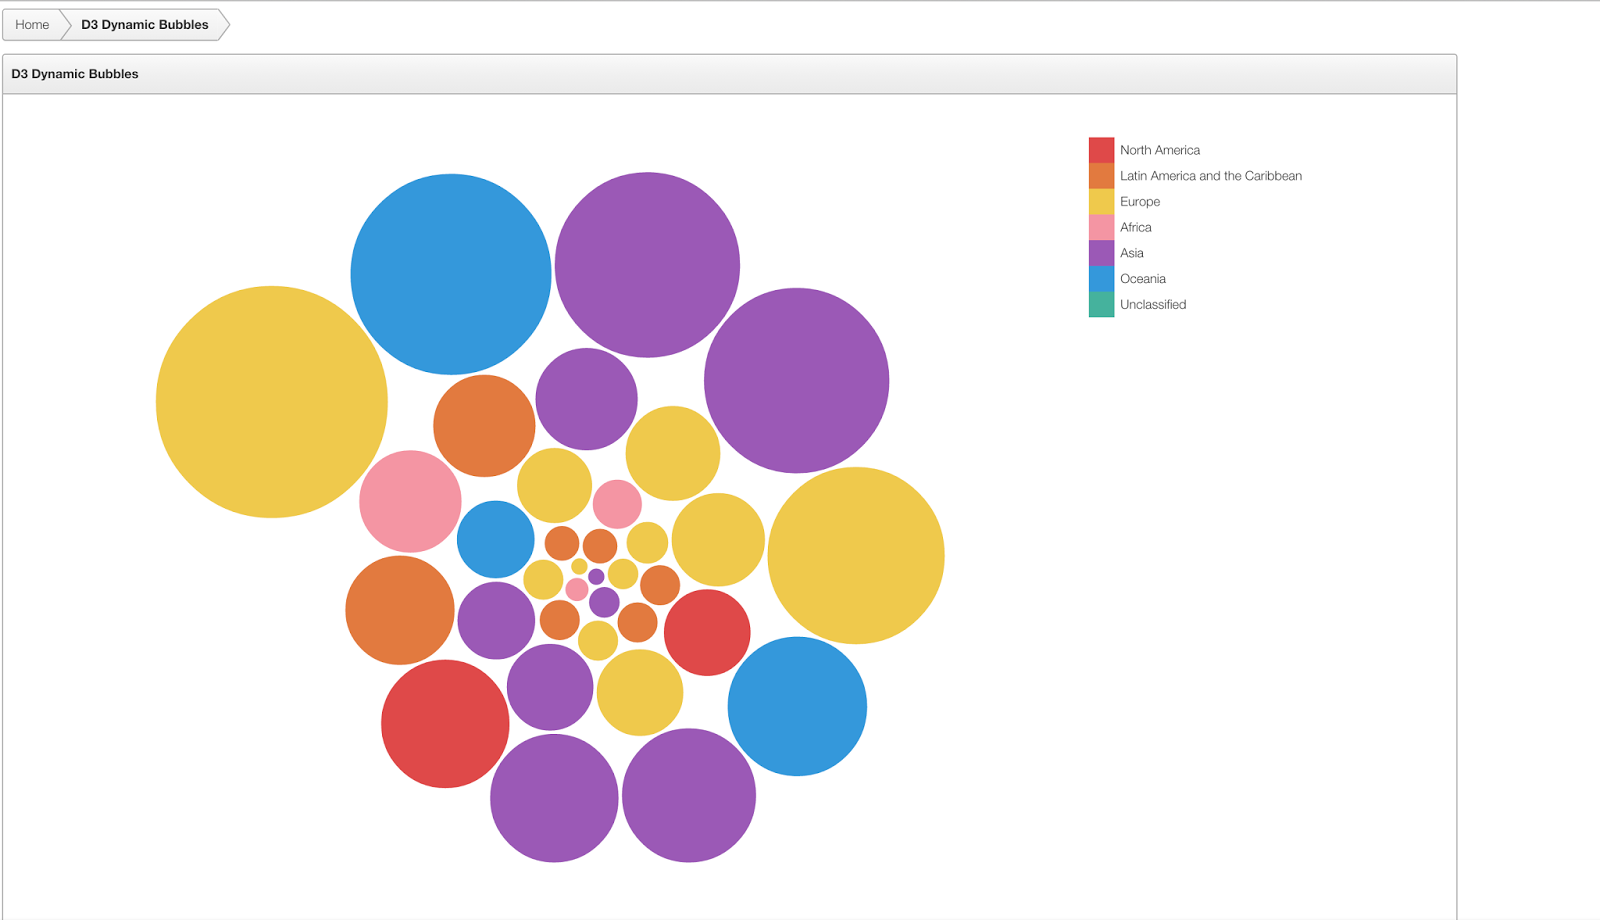
D3 pulling dynamic data from the database in the form of a bubble chart. I promised to share the code so here it is.
It's really quite simple. In short, i've created a table, D3_COUNTRIES, which contains 10 sets of rows each with a country code, name and a value. The Javascript code on the page has an interval that runs every 2 seconds, and each time calls an Ajax callback process to get another set of country data. The code then uses D3 to create a bubble chart for that data, using a nice transition between each set.
First of all create the table and upload the data. Here's the DDL to create the D3_COUNTRIES table.
 CREATE TABLE "D3_COUNTRIES"
   (     "ID" NUMBER(10,0),
      "COUNTRY_CODE" VARCHAR2(2) NOT NULL ENABLE,
      "COUNTRY_NAME" VARCHAR2(100) NOT NULL ENABLE,
      "CREATED_DATE" DATE,
      "VALUE" NUMBER(4,0),
      "DATA_GROUP" NUMBER(5,0),
       CONSTRAINT "D3_COUNTRIES_PK" PRIMARY KEY ("ID")
  USING INDEX ENABLE
   )
 /
You can get the sample data using the following link:
D3CountriesDataExport
You'll need to use SQL Workshop -> Utilities -> Data Workshop -> Data Load -> Text Data in APEX to upload the data into the D3_COUNTRIES table.
Next, create a new page in APEX with a HTML region. You'll need to put the following CSS either in the Inline section of CSS on the Page Attributes, or as a file on the file system or under Shared Components -> Cascading Style Sheets.
 * { -moz-box-sizing: border-box; -webkit-box-sizing: border-box; box-sizing: border-box; }
 body {
   font-family: "HelveticaNeue-Light", "Helvetica Neue Light", "Helvetica Neue", "Roboto Light", "Segoe UI Web Light", "Segoe UI Light", "Segoe UI Web Regular", "Segoe UI", Helvetica, Arial, sans-serif;
   margin: 1em;
   background: #293950;
   color: #ecf0f0;
 }
 header {
 }
 h1, h2, h3 {
      margin: 0;
      text-rendering: optimizeLegibility;
 }
 h1 {
      font-size: 2.4em;
      line-height: 1.4em;
      font-family: 'Lobster Two';
      font-style: italic;
      text-shadow: 2px 4px 0 rgba(0,0,0,0.4);
 }
 h2 {
      font-size: 1em;
      text-transform: uppercase;
      font-weight: normal;
      text-shadow: 1px 1px 2px rgba(0, 0, 0, 0.8);
 }
 p, footer {
      margin: 1em 0 .5em;
      color: silver;
 }
 footer {
      font-size: .8em;
      margin-top: 3em;
 }
 fieldset {
      border: 0;
      z-index: -1;
      margin: 0;
 }
 fieldset p {
      position: absolute;
      left: 1em;
      opacity: 0.5;
 }
 fieldset p > span {
      font-size: 2em;
 }
 legend {
      width: 100%;
      float: left;
      margin-top: 1em;
 }
 #chart {
      width: 100%;
      text-align: center;
      float: left;
 }
 input[type=button], select {
      font-family: "HelveticaNeue-Light", "Helvetica Neue Light", "Helvetica Neue", "Roboto Light", "Segoe UI Web Light", "Segoe UI Light", "Segoe UI Web Regular", "Segoe UI", Helvetica, Arial, sans-serif;
      margin-top: 2em;
      background: #5F799C;
      border: 0 none;
       border-radius: 3px;
       color: #fff;
       cursor: pointer;
       font-size: 1em;
       line-height: 1.4em;
       padding: 0.3em 1.4em;
 }
 select {
      margin: 0.5em 0 2em;
      -webkit-appearance: none;
      -moz-appearance: none; /* doesn't seem to be working */
      padding: 0.3em 2.4em 0.3em 1.1em;
      background: #5F799C url(../images/dropdown-arrow.png) no-repeat 90% 50%;
 }
 /* graph */
 legend > div {
      width: 24px;
      height: 24px;
 }
 legend > div::after {
      content: attr(data-category);
      display: inline-block;
      margin-left: 30px;
      line-height: 24px;
      width: 250px;
 }
 circle, .other {
  fill: #1abc9c;
 }
 /*
 ISO Country code by regions: http://www.geohive.com/earth/gen_codes.aspx
 */
 /* Northern America */
 .bm, .ca, .gl, .pm, .us,
 .noram {fill: #DF4949; background: #DF4949;}
 /* Latin America and the Caribbean */
 .ai, .ag, .aw, .bs, .bb, .bq, .vg, .ky, .cu, .cw, .dm, .do, .gp, .ht, .jm, .mq, .ms, .pr, .bl, .kn, .lc, .mf, .vc, .sx, .tt, .vi,
 .bz, .crr, .sv, .gt, .hn, .mx, .ni, .pa,
 .ar, .bo, .br, .cl, .co, .ec, .fk, .gf, .gy, .py, .pe, .sr, .uy, .ve,
 .latam {fill: #E27A3F; background: #E27A3F;}
 /* Europe */
 .by, .bg, .cz, .hu, .md, .pl, .ro, .ru, .sk, .ua,
 .ax, .dk, .ee, .fo, .fi, .gg, .is, .ie, .je, .lv, .lt, .im, .no, .sj, .se, .gb,
 .al, .ad, .ba, .hr, .gi, .gr, .va, .it, .mk, .mt, .me, .pt, .sm, .rs, .si, .es,
 .at, .be, .fr, .de, .li, .lu, .mc, .nl, .ch,
 .eu { fill: #EFC94C; background: #EFC94C;}
 /* Asia */
 .kz, .kg, .tj, .tm, .uz,
 .cn, .hk, .mo, .jp, .kp, .kr, .mn, .tw,
 .af, .bd, .bt, .in, .ir, .mv, .np, .pk, .lk,
 .bn, .kh, .id, .la, .my, .mm, .ph, .sg, .th, .tl, .vn,
 .am, .az, .bh, .cy, .ge, .iq, .il, .jo, .kw, .lb, .ps, .om, .qa, .sa, .sy, .tr, .ae, .ye,
 .asia { fill: #9B59B6; background: #9B59B6;}
 /* Oceania */
 .au, .cx, .cc, .nz, .nf,
 .fj, .nc, .pg, .sb, .vu,
 .gu, .ki, .mh, .fm, .nr, .mp, .pw,
 .as, .ck, .pf, .nu, .pn, .ws, .tk, .to, .tv, .wf,
 .oceania {fill: #3498db; background: #3498db;}
 /* Africa */
 .bi, .km, .dj, .er, .et, .ke, .mg, .mw, .mu, .yt, .mz, .re, .rw, .sc, .so, .tz, .ug, .zm, .zw,
 .ao, .cm, .cf, .td, .cg, .cd, .gq, .ga, .st,
 .dz, .eg, .ly, .ma, .ss, .sd, .tn, .eh,
 .bw, .ls, .na, .za, .sz,
 .bj, .bf, .cv, .gm, .gh, .gn, .gw, .lr, .ml, .mr, .ne, .ng, .sh, .sn, .sl, .tg,
 .africa {fill: #F495A3; background: #F495A3;}
 /* Unclassified */
 .aq, .bv, .io, .tf, .hm, .gs, .um,
 .a1, .a2, .o1,
 .other { fill: #45B29D; background: #45B29D;}
 @media only screen and (min-width: 500px) {
      h1 {
           font-size: 4.75em;
           line-height: 1.5em;
      }
      fieldset p > span {
           font-size: 3em;
      }
 }
 @media only screen and (min-width: 900px) {
      fieldset p {
           bottom: 0;
      }
      legend {
           width: 25%;
           float: right;
           margin-top: 0;
      }
      #chart {
           width: 75%;
           text-align: center;
           float: left;
           margin-top: -35px;
      }
      input[type=button] {
           margin-top: 4em;
      }
 }
Then create an Ajax callback process ('On demand - Run this process when requested by Ajax'), using the following code. Call it 'GETDATA'. This gets a single set of country data at a time from the D3_COUNTRIES table and returns it in JSON format.
DECLARE
  l_firstrow boolean := false ;
 BEGIN
  HTP.p ( '{"row": {' );
  FOR i IN (select country_code, value from d3_countries where data_group = APEX_APPLICATION.g_x01) LOOP
    htp.p (apex_javascript.add_attribute ( i.country_code , i.value));
  END LOOP;
  htp.p ( '"":""}}' );
 EXCEPTION
  WHEN OTHERS THEN
   HTP.p ('{"row":[]}');
 END;
Now, add the following Javascript. I've added it as a file (d3bubble.js) under Shared Components -> Static Files, which I reference in my HTML using #WORKSPACE_IMAGES#, but you might choose to put it inline or on your server. This code does the Ajax call to the 'GETDATA' process created previously, which is done within an interval. It then uses that data to create the D3 bubble transitions.
(function() {
      /* D3 Bubble Chart */
      var diameter = Math.min(document.getElementById('chart').clientWidth, window.innerHeight - document.querySelector('header').clientHeight) - 20;
      var svg = d3.select('#chart').append('svg')
           .attr('width', diameter)
           .attr('height', diameter);
      var bubble = d3.layout.pack()
           .size([diameter, diameter])
           .value(function(d) {return d.size;}) // new data is loaded to bubble layout
           .padding(3);
      function drawBubbles(m) {
           // generate data with calculated layout values
           var nodes = bubble.nodes(processData(m))
                .filter(function(d) { return !d.children; }); // filter out the outer bubble
           // assign new data to existing DOM
           var vis = svg.selectAll('circle')
                .data(nodes, function(d) { return d.name; });
           // enter data -> remove, so non-exist selections for upcoming data won't stay -> enter new data -> ...
           // To chain transitions,
           // create the transition on the updating elements before the entering elements
           // because enter.append merges entering elements into the update selection
           var duration = 200;
           var delay = 0;
           // update - this is created before enter.append. it only applies to updating nodes.
           vis.transition()
                .duration(duration)
                .delay(function(d, i) {delay = i * 7; return delay;})
                .attr('transform', function(d) { return 'translate(' + d.x + ',' + d.y + ')'; })
                .attr('r', function(d) { return d.r; })
                .style('opacity', 1); // force to 1, so they don't get stuck below 1 at enter()
           // enter - only applies to incoming elements (once emptying data)
           vis.enter().append('circle')
                .attr('transform', function(d) { return 'translate(' + d.x + ',' + d.y + ')'; })
                .attr('r', function(d) { return d.r; })
                .attr('class', function(d) { return d.className; })
                .style('opacity', 0)
                .transition()
                .duration(duration * 1.2)
                .style('opacity', 1);
           // exit
           vis.exit()
                .transition()
                .duration(duration + delay)
                .style('opacity', 0)
                .remove();
      }
      function getData() {
         var t = 1;
         setInterval(function () {
            apex.server.process("GETDATA"
              ,{x01: t}
              ,{
              success: drawBubbles,
              dataType: "json"
              }
              );
            t++;
            if(t==11){t = 1};
         },2000);
      }
      function processData(data) {
           if(!data) return;
           var obj = data.row;
           var newDataSet = [];
           for(var prop in obj) {
                newDataSet.push({name: prop, className: prop.toLowerCase().replace(/ /g,''), size: obj[prop]});
           }
           return {children: newDataSet};
      }
      getData();
 })();
Finally, add the following to the Region Source in your HTML Region. This includes the D3 file, which I've had to get using HTTPS as I'm using the online Apex instance.
 <div>
      <fieldset>
           <p<br><br><br><span id="region"></span></p>
           <legend>
                <div data-category="North America" class="noram"></div>
                <div data-category="Latin America and the Caribbean" class="latam"></div>
                <div data-category="Europe" class="eu"></div>
                <div data-category="Africa" class="africa"></div>
                <div data-category="Asia" class="asia"></div>
                <div data-category="Oceania" class="oceania"></div>
                <div data-category="Unclassified" class="other"></div>
           </legend>
 <section id="chart"></section>
      </fieldset>
 <script type="text/javascript" src="https://cdnjs.cloudflare.com/ajax/libs/d3/3.4.11/d3.min.js"></script>
 <script type="text/javascript" src="#WORKSPACE_IMAGES#d3bubble.js"></script>
 </div>
That's it! When I get time I will look to add text label (e.g. Country Code and Value) to each bubble, but I've not quite figured that out.


Comments